Largest Contentful Paint (LCP): What It Is, How to Measure & Optimize
What the Largest Contentful Paint measures, which element counts and which of the four phases to fix first.

Largest Contentful Paint (LCP) in Short
Largest Contentful Paint (LCP) measures how long it takes for the largest visible content element (an image, video, or text block) to render in the viewport. A good LCP score is under 2.5 seconds. LCP is one of the three Core Web Vitals and represents the loading experience of a web page.
On most pages the LCP element is the hero image or the main heading. When it shows up fast, the visitor feels the page is fast, whatever else is still loading.

What is the Largest Contentful Paint (LCP)?
The Largest Contentful Paint is the render time of the largest content element (an image, video or text block) painted in the visible part of the screen. The LCP value is the time in milliseconds between requesting the page and the moment that element is displayed above the fold.
Some people call it "last contentful paint". It is about the largest element: a smaller element that is painted later does not change it.
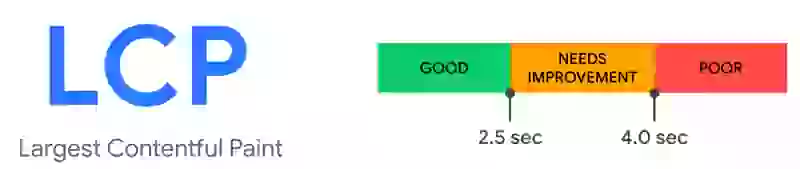
Table of Contents!
- Largest Contentful Paint (LCP) in Short
- What is the Largest Contentful Paint (LCP)?
- History of the Largest Contentful Paint
- LCP vs FCP: What is the Difference?
- Why LCP Matters
- Which Elements are Considered LCP Elements?
- What is a Good LCP Score?
- What CoreDash Data Shows
- How LCP is Measured: The Four Key Phases
- Common LCP Mistakes
- How to Measure the Largest Contentful Paint
- Improving the Largest Contentful Paint
- Related Guides
- Frequently Asked Questions About LCP
History of the Largest Contentful Paint
Why not measure loading speed as 'the time it takes for the page to load'?
Because on most modern websites you can't say when the page has loaded. Lazy loading and progressive loading mean a page can keep loading for as long as the visitor stays. One point in time does not describe page speed.

A page can feel slow at several moments while it loads. The server answers late (Time to First Byte), nothing shows up for a while (First Contentful Paint) or the hero is still a grey box when the rest is there (Largest Contentful Paint). Or the first click does nothing.
LCP was picked because it follows what the visitor sees. When the LCP happens, most visitors think the page is done, even when scripts are still running. The metric was built to answer one question: 'When is the content of a page visible?'.
LCP vs FCP: What is the Difference?
Largest Contentful Paint (LCP) and First Contentful Paint (FCP) both measure loading performance, but they measure different moments. FCP fires as soon as the browser paints the first pixel of content, which could be a tiny navigation bar or a loading spinner. LCP fires when the largest meaningful element renders in the viewport.
FCP tells you the page has started to load. LCP tells you the page feels loaded, which is why Google made LCP the Core Web Vital.
| First Contentful Paint (FCP) | Largest Contentful Paint (LCP) | |
|---|---|---|
| What it measures | First pixel of content painted | Largest content element rendered |
| Good threshold | < 1.8 seconds | < 2.5 seconds |
| Core Web Vital? | No (diagnostic metric) | Yes |
| User perception | "Something is happening" | "The page is loaded" |
| Typical element | Navigation bar, heading, spinner | Hero image, main heading, video poster |
For most websites, work on LCP first. FCP always happens before LCP, so a fast LCP usually comes with a fast FCP. A fast FCP says little about LCP: a page can paint its header at 0.8 seconds and its hero image at 4.
Why LCP Matters
As a Core Web Vital, LCP matters for SEO. It matters more for your visitors: nobody likes to wait, and most traffic is mobile, where pages load slower.

- Rankings. LCP is part of Google's Core Web Vitals, and Google uses page speed as a ranking factor.
- Visitors. A visitor who stares at a white screen or a grey box where the hero should be leaves. The Vodafone test below put a number on it.
- Google Ads. Landing page experience is part of your Quality Score. A slow landing page makes every click more expensive.
Case Study: Vodafone (31% LCP Improvement, 8% More Sales)
Vodafone Italy split traffic 50/50 between the old landing page and a faster copy that looked and worked the same. The faster copy rendered on the server instead of in client-side widgets, served a resized hero image, deferred the images below the fold and used smaller SVG and PNG files. LCP went from 8.3 to 5.7 seconds (31% faster) and sales went up 8%. (Vodafone case study on web.dev)
Test: Google Flights (fetchpriority Saved 700ms)
In a test on the Google Flights page, adding fetchpriority="high" to the LCP image took LCP from 2.6 to 1.9 seconds. Without it, Chrome requests images at low priority and only raises the priority once layout shows the image is in the viewport. On a busy page that is hundreds of milliseconds of waiting. Learn more about resource prioritization for Core Web Vitals.
Which Elements are Considered LCP Elements?
Not every element can be the LCP element. It has to be painted in the visible part of the screen (the viewport) before the user interacts with the page.
The element has to be:
- An
<img>element. - An
<image>element nested inside an <svg> element. - A
<video>element (the poster image or first video frame, whichever happens earlier, is used). - An element with a background image loaded via the CSS
url()function. It counts, but the preload scanner can't see it, so the browser finds the image late. More in deferring background images. -
A block-level element containing text nodes or other inline text elements (in case of inline text elements like
<span>the nearest block-level element<div>or<p>is considered).
Some elements are skipped: elements with opacity: 0, images that cover the whole viewport (Chrome treats those as background) and low-entropy images. Since Chrome 112, an image with less than 0.05 bits of image data per displayed pixel is ignored as a placeholder. Chrome changes these rules from time to time.

How the LCP Element Size is Measured
The browser calculates the size of each candidate with these rules:
- Viewport only: Only the visible part of the page is considered. If an element is only partially in the visible viewport, the considered size will be clipped.
- No border, padding or margin: For all elements, text and image borders, padding and margins are completely ignored.
- Text size: Text elements get reported as the smallest rectangle that can be painted around the text node(s).
- Image size: For images, the smallest of the intrinsic dimensions (the original width and height) and the display size (the size on screen) is used to calculate LCP element size.
- First size counts: When layout changes or when an element size changes, only the first size is considered for the LCP.
- Removed elements are included: When an element is removed from the DOM it is still an LCP candidate.
The LCP Element Can Change During Load
A page renders in stages, so the LCP element often changes while the page loads. Until the first user interaction, the browser reports every new LCP candidate. When a new element is painted that is visible in the viewport and larger than the previous candidate, it becomes the new LCP element.
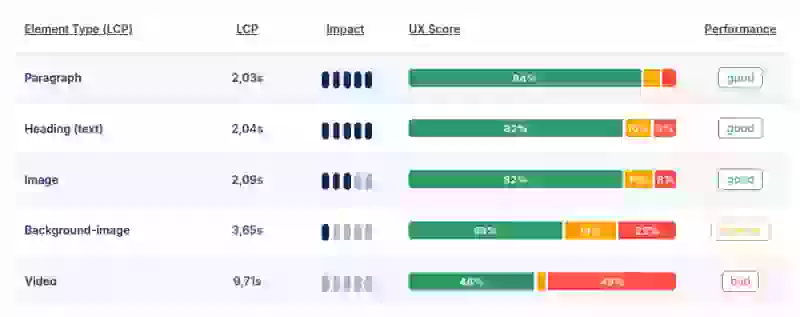
Take-aways from LCP field data: At CoreDash we track millions of LCP entries per day. On mobile the LCP element is often a paragraph or a heading. On desktop the wider viewport fits a bigger image, so the same page often has a different LCP element on each device. Check both before you decide what to fix.
What is a Good LCP Score?
To pass the LCP part of the Core Web Vitals, at least 75% of your page visits need a good LCP: under 2.5 seconds. Between 2.5 and 4 seconds needs improvement, above 4 is poor. Check the mobile tab in PageSpeed Insights first. The field data at the top is the p75 of the last 28 days.
| Good | Needs Improvement | Poor | |
|---|---|---|---|
| Largest Contentful Paint | < 2500ms | 2500ms - 4000ms | > 4000ms |
What CoreDash Data Shows
Image LCP vs Text LCP
Pages with image-based LCP elements have a p75 LCP of 744ms, nearly twice as slow as text-based LCP elements at 388ms. Most of that gap comes from how late the browser finds and requests the image (see the four phases below).
The Impact of Preloading and Lazy Loading
Preloaded LCP images have a p75 of 364ms and no poor page loads. Lazy-loaded LCP images sit at 720ms, with 4.3% of page loads rated poor, and images that are not preloaded at 752ms. Never lazy load the LCP image, and make sure it is requested early: in the HTML with fetchpriority="high", or preloaded when it is not.
Mobile vs Desktop LCP
Mobile LCP (764ms at the 75th percentile) is twice the desktop LCP (380ms). Mobile networks are slower and phones have less CPU. Google rates mobile and desktop separately, and mobile is where most sites fail, so start there.
LCP Across the Web
In the CrUX release for August 2026, 68.1% of origins had a good LCP, up from 66.7% a year earlier. That is still the lowest of the three Core Web Vitals (INP 85.3%, CLS 81.5%), so for most sites LCP decides whether they pass.
The HTTP Archive crawl adds what CrUX does not collect. In the 2025 Web Almanac, the LCP element is an image on 76% of mobile pages and about 16% of pages lazy load it. Only 17% of mobile pages with an LCP image use fetchpriority="high". About 2% preload it.
How LCP is Measured: The Four Key Phases
According to Google, the Largest Contentful Paint can be broken down into 4 sub-parts. Each phase needs a different fix, so first find out which phase is slow. A slow Time to First Byte (TTFB) needs server-side work, while a slow resource load delay needs changes to your HTML.

The LCP time is the sum of these four phases:
- Time to First Byte (TTFB): The server response time. It covers everything from the DNS lookup, through the TCP/TLS connection, to the moment the browser receives the first byte of the HTML document. A slow TTFB pushes back everything after it. The usual reason is HTML that is not cached, so every visit builds the page again in PHP or Node. A CDN that doesn't cache the HTML only makes the images faster.
- Resource Load Delay: The time between TTFB completing and the browser actually starting to download the LCP resource. A long delay here means the browser found the LCP resource late. This usually comes from CSS background images (which the preload scanner cannot discover) or client-side rendering (where the LCP element only appears after JavaScript executes). Put the LCP element in the initial HTML, and preload the LCP image only when that is not possible.
- Resource Load Duration: How long it takes to download the LCP resource (the image, font, or video). This phase depends on file size and the network: AVIF or WebP, a
srcsetso phones get a phone sized image. On most sites it is the shortest of the four. - Element Render Delay: The time between when the LCP resource finishes downloading and when the element is fully rendered on screen. The image is there, but the browser can't paint it yet. Render-blocking CSS and JavaScript on the main thread are the usual reasons. A classic one is an A/B testing snippet that hides the page until the test script has loaded.
Google looked at real Chrome navigations with an image LCP and split the p75 LCP into these phases. The median origin in each group:
| LCP rating | TTFB | Load delay | Load duration | Render delay |
|---|---|---|---|---|
| Good | 600ms | 350ms | 160ms | 230ms |
| Needs improvement | 1,360ms | 720ms | 270ms | 310ms |
| Poor | 2,270ms | 1,290ms | 350ms | 360ms |
On sites with a poor LCP, TTFB and load delay together take more than 3.5 seconds. Downloading the image takes 350ms. Most origins with a poor LCP spend less than 10% of their LCP downloading the LCP image.
For the steps to find and fix each phase, read Fix & Identify Largest Contentful Paint (LCP) issues.
Common LCP Mistakes
Mistake 1: Lazy-Loading the LCP Image
loading="lazy" tells the browser to wait with the download until the image is close to the viewport. The LCP image is already in the viewport, so the browser first has to do layout to find that out, and only then starts the download. Themes and page builders often add it to every image, the hero included. Remove it from the LCP image. That's all. According to the 2025 Web Almanac, about 16% of pages do this. Read the guide on how to fix a lazily-loaded LCP image.
Mistake 2: The LCP Image Is Found Late
A slider or a client-side rendered hero only puts the image URL on the page after the CSS is parsed or JavaScript has run. That costs hundreds of milliseconds before the download even starts. The best fix is a normal <img> in the HTML. When that is not possible, add a preload hint in the <head>:
<link rel="preload" as="image" href="/img/hero.webp" fetchpriority="high"> The browser starts the download right away. A preload alone does not raise the priority, so keep fetchpriority="high" on it, or the image still waits behind stylesheets and scripts. More in the guide to preloading the LCP image.
Mistake 3: A CSS Background Image as the LCP Element
The preload scanner cannot see a background-image: url(...). The browser only finds the image after it has downloaded the HTML and the CSS and matched the rule to an element on the page. That adds resource load delay. The fix is to use a standard <img> tag instead, with the fetchpriority="high" attribute:
<img src="/img/hero.webp"
     alt="Descriptive alt text"
     width="1200"
     height="600"
     fetchpriority="high">
Now the preload scanner finds it in the HTML, and fetchpriority="high" puts it at the front of the queue. More in the guide to resource prioritization.
How to Measure the Largest Contentful Paint
Measure the Largest Contentful Paint with JavaScript
The quickest way is a PerformanceObserver. This snippet logs the LCP time and element:
new PerformanceObserver((list) => {
    const lcpEntry = list.getEntries().at(-1);
    console.log('LCP value: ', lcpEntry.startTime);
    console.log('LCP element: ', lcpEntry.element, lcpEntry.url);
  }).observe({ type: 'largest-contentful-paint', buffered: true });
For more than a quick check, use the Web Vitals Library.
Measure Largest Contentful Paint (LCP) in Chrome DevTools
- Open Chrome DevTools by pressing Ctrl+Shift+I (or Cmd+Option+I on Mac).
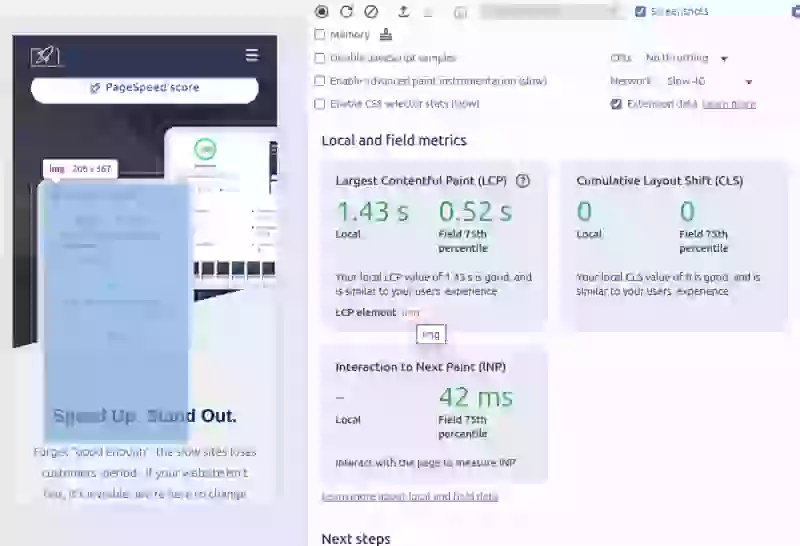
- Go to the Performance panel. It shows the LCP of the current page right away, with the LCP element.
- Click the reload button in the panel to record a trace. The LCP marker in the trace shows the LCP element and its four phases.
The full walkthrough, with what to look for in the trace, is in diagnose LCP with Chrome DevTools.
Measure the Largest Contentful Paint with Lab and Field Tools
Lab and field data do different jobs. You need both.
- Field data (RUM and CrUX) is what Google uses to decide whether you pass. It is what your real users get. Start here to find out if you have a problem.
- Lab data (Lighthouse, etc.) is a controlled test. Google doesn't rank on it, but you need it for debugging: it tells you why you have a problem.
The tools:
| Tool Name | Data Type | Primary Use Case | When to Use It |
|---|---|---|---|
| PageSpeed Insights | Lab & Field (CrUX) | Quick audit & real-user performance overview | Start here. Use field data to confirm a problem, then use lab data for an initial diagnosis. |
| Chrome DevTools | Lab | Debugging & performance profiling | To precisely identify what is blocking the LCP element on your local machine. |
| WebPageTest | Lab | Detailed waterfall analysis & visual comparison | For advanced analysis of the network request chain and testing from different locations. |
| CoreDash (RUM) | Field | Tracking trends & real-world issue correlation | For continuous monitoring and understanding the full distribution of user experiences. |
Improving the Largest Contentful Paint
Take your slowest template on mobile and look at its four LCP phases: CoreDash shows them per page for real visitors, DevTools for a single load. In the field data above, TTFB and load delay are the big ones on almost every site with a poor LCP, so start there.
Converting the hero image to AVIF is what everyone tries first. On a site with a 4 second LCP, the whole download is about 350ms, so a smaller file saves a fraction of that. Do it, but do it last.
Per phase:
- TTFB: cache the HTML, at the server or at the CDN. Read more in our guide to optimizing TTFB.
- Resource Load Delay: an
<img>in the HTML, noloading="lazy",fetchpriority="high". See fixing Resource Load Delay. - Resource Load Duration: a smaller file, sized for the device. See how to Optimize the LCP Image. You can also read about how we lowered LCP by 70% on a real project.
- Element Render Delay: less render-blocking CSS, scripts deferred, no anti-flicker snippets. See fixing Element Render Delay.
Related Guides
Each part of LCP has its own guide:
- Fix & Identify LCP Issues: find which phase is slow, with DevTools, WebPageTest and CoreDash.
- Diagnose LCP with Chrome DevTools: the LCP marker in a Performance trace.
- Optimize the LCP Image: formats, sizes and
srcset. - Resource Load Delay: getting the LCP image requested early.
- Resource Load Duration: the download itself.
- Element Render Delay: when the image is in but not yet painted.
Search Console flagged your site?
I deliver a prioritized fix list backed by field data. Not a 50 page PDF.
Request auditFrequently Asked Questions About LCP
What is a good LCP score?
A good Largest Contentful Paint (LCP) score is under 2.5 seconds. To pass the Core Web Vitals assessment, at least 75% of your page loads must achieve a "good" LCP score. Scores between 2.5 and 4 seconds are rated "needs improvement," and anything above 4 seconds is rated "poor."
What causes a slow LCP?
A slow LCP comes from one or more of the four LCP phases. The server is slow, the browser finds the LCP image late, the file is too big or the main thread is busy when the image is ready. On sites with a poor LCP, TTFB and resource load delay are usually the biggest phases. Lazy loading the LCP image and a CSS background image as the LCP element both cause load delay. In CoreDash data, lazy-loaded LCP images are about 2x slower than preloaded ones.
What elements qualify as the LCP element?
It can be an <img>, an <image> inside an <svg> or the poster image of a <video>. Background images count. So does text. The element must be visible in the viewport and painted before the user's first interaction. Elements hidden with opacity: 0, full-viewport cover images, and low-entropy placeholder images are excluded.
What is the difference between LCP and FCP?
First Contentful Paint (FCP) measures when the first pixel of content appears on screen, while Largest Contentful Paint (LCP) measures when the largest content element is fully rendered. FCP indicates the page has started loading; LCP indicates the page feels loaded. LCP is a Core Web Vital with a "good" threshold of 2.5 seconds. FCP is a diagnostic metric with a "good" threshold of 1.8 seconds. For most sites, work on LCP first: FCP always happens before LCP, so a faster LCP usually brings FCP down with it.
Does fetchpriority="high" improve LCP?
Yes. The fetchpriority="high" attribute tells the browser to prioritize downloading the specified resource over other requests. When applied to the LCP image, it shortens the time before the image download starts. In a test on Google Flights, it took LCP from 2.6 to 1.9 seconds. Put it on the <img> itself. Add a <link rel="preload"> only when the image is not in the HTML, and give the preload fetchpriority="high" as well.

