What Are the Core Web Vitals? LCP, INP & CLS Explained (2026)
Everything you need to know about the Core Web Vitals: metrics, thresholds, measurement tools, and how to pass them.

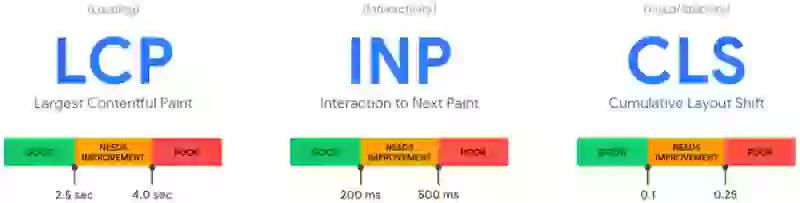
The Core Web Vitals are three Google metrics, measured on real visitors: Largest Contentful Paint (LCP) for loading, good under 2.5 seconds; Interaction to Next Paint (INP) for responsiveness, good under 200 milliseconds; and Cumulative Layout Shift (CLS) for visual stability, good under 0.1. Google checks them at the 75th percentile of your visits.
The Core Web Vitals in Short
Google uses the Core Web Vitals to judge how your pages load, respond and hold still. There are three: Largest Contentful Paint (LCP), Interaction to Next Paint (INP) and Cumulative Layout Shift (CLS).
What are the Core Web Vitals?
Each Core Web Vital covers one moment of a visit. The data comes from real Chrome users:
- Loading (LCP): how long before the main content is on screen
- Interactivity (INP): how long the page takes to react to a click, tap or key press
- Stability (CLS): how much the content moves while it loads
The set changes. In March 2024, INP replaced First Input Delay (FID). FID only timed the wait before the first interaction got handled. INP times every interaction from start to finish, and a lot more sites fail it.
Table of Contents!
- The Core Web Vitals in Short
- What are the Core Web Vitals?
- When do you pass the Core Web Vitals?
- The Three Core Web Vitals Metrics
- Why Do the Core Web Vitals Matter?
- Field Data vs. Lab Data
- How to Measure the Core Web Vitals
- How Many Sites Pass?
- How to Improve the Core Web Vitals
- Core Web Vitals in Search Console
- Core Web Vitals FAQ
When do you pass the Core Web Vitals?
Google rates each metric Good, Needs Improvement or Poor. You pass when at least 75% of the page visits in CrUX have a good LCP, a good INP and a good CLS. Google looks at the URL first. When that URL has too little traffic, it falls back to a group of similar URLs, or to the whole origin. PageSpeed Insights shows the result above everything else on the page: "Core Web Vitals Assessment: Passed" or "Failed".
| Good | Needs Improvement | Poor | |
|---|---|---|---|
| Largest Contentful Paint | < 2500ms | 2500ms - 4000ms | > 4000ms |
| Interaction to Next Paint | < 200ms | 200ms - 500ms | > 500ms |
| Cumulative Layout Shift | < 0.1 | 0.1 - 0.25 | > 0.25 |
Why the 75th Percentile?
The median only tells you about the faster half of your visitors. A stricter percentile would let a few visits from a train with one bar of signal fail the whole page. p75 sits in between: three out of four visits need to be good.
Your own laptop on office wifi tells you very little. The visits that decide p75 are the slower phones on mobile networks.
The Three Core Web Vitals Metrics
Largest Contentful Paint (LCP): Loading
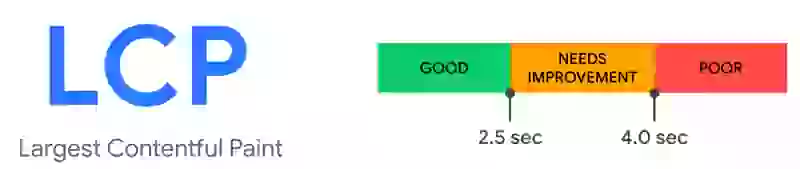
The Largest Contentful Paint measures loading: the time from the start of the navigation until the largest element in the viewport is painted.
That element has to have content: an image (background images and video posters count too) or a block of text. On most pages the LCP element is the hero image or the main heading.
Good is under 2.5 seconds. In the CrUX release for August 2026, 68.1% of origins managed that, the lowest of the three.
LCP follows what the visitor sees. Once the largest element is on screen, most people think the page is done, even when scripts are still loading. The metric was built to answer one question: 'When is the content of a page visible?'.
When the LCP element is late, the reason is usually boring. loading="lazy" on the hero image. A hero set as a CSS background, so the browser only finds it after the stylesheet is in. A slider script that has to run before the first slide shows. Fix the discovery first, then preload the image if the HTML still hides it, give it fetchpriority="high" and make the file smaller. The Largest Contentful Paint guide goes through all four LCP phases.
Interaction to Next Paint (INP): Interactivity

The Interaction to Next Paint measures interactivity: how long it takes before the screen updates after a visitor clicks, taps or presses a key. Scrolling and hovering do not count.
Each interaction is timed from the input, through the JavaScript it triggers, to the next frame on screen. The page gets the time of its slowest interaction. On pages with a lot of interactions Google skips one outlier for every 50 interactions, which comes down to roughly the 98th percentile.
A normal Lighthouse run cannot measure INP. It loads the page and never clicks anything. The closest lab number is Total Blocking Time. INP is usually a lot lower than TBT, but when TBT goes down, INP tends to follow.
Often the click handler itself is fast. The main thread is busy with something else when the click comes in: a tag manager, a chat widget, a framework still hydrating. Most of that JavaScript can be deferred or scheduled. 85.3% of origins had a good INP in August 2026, down from 87.2% in March (CrUX release notes). It is the only Core Web Vital that got worse over the last year. The Interaction to Next Paint guide shows how to find the slow interactions.
Cumulative Layout Shift (CLS): Visual Stability
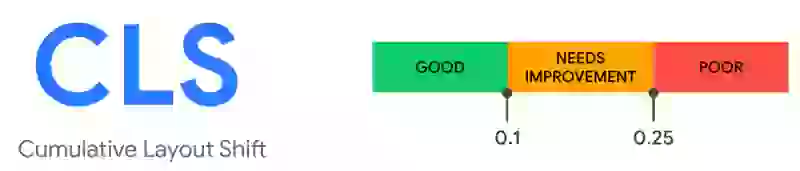
The Cumulative Layout Shift measures visual stability: how much visible content moves without the visitor asking for it. You go to tap a link and the page jumps.
Every shift gets a score: the impact fraction (how much of the viewport is affected) times the distance fraction (how far the content moved, relative to the viewport). Shifts that happen close together are added up in a session window. The CLS of the page is its worst session window.
The usual causes: images without width and height; ads, cookie banners and embeds that push content down when they arrive; and a web font that is wider or taller than its fallback. For fonts, self host them and pick the right font-display setting. CLS is the metric most sites get right: 81.5% of origins had a good CLS in August 2026. More in the Cumulative Layout Shift guide.
Why Do the Core Web Vitals Matter?
- Visitors leave. A button that does nothing for half a second gets clicked twice, then abandoned. Google collected case studies of sites that fixed their Core Web Vitals and got lower bounce rates and more conversions.
- Rankings. The Core Web Vitals are a Google ranking factor. A small one. When two pages are about equally good, the faster one has the edge.
- Mobile. Most of your traffic is probably on a phone, and that is where pages fail. The 2025 Web Almanac (the latest edition) found 48% of mobile pages passing against 56% on desktop.
- Google Ads. Landing page experience is part of your Quality Score. A slow landing page drags it down and every click costs more.
Google also documents exactly how each metric is measured, down to the browser code. For a ranking factor, that almost never happens.
Vodafone Case Study
Vodafone Italy improved their Largest Contentful Paint by 31% and got 8% more sales, 15% more leads and an 11% better cart to visit rate (source: web.dev case study).
Field Data vs. Lab Data
Field data (also called Real User Monitoring or RUM data) comes from your real visitors, on their own devices and networks. Google's CrUX dataset is field data from Chrome users who opted in. The Core Web Vitals are field data only.
Lab data comes from a test on a simulated device in a fixed setup. Lighthouse and WebPageTest produce lab data. A lab test gives you roughly the same result every run, which makes it good for debugging. It does not tell you what your visitors get.
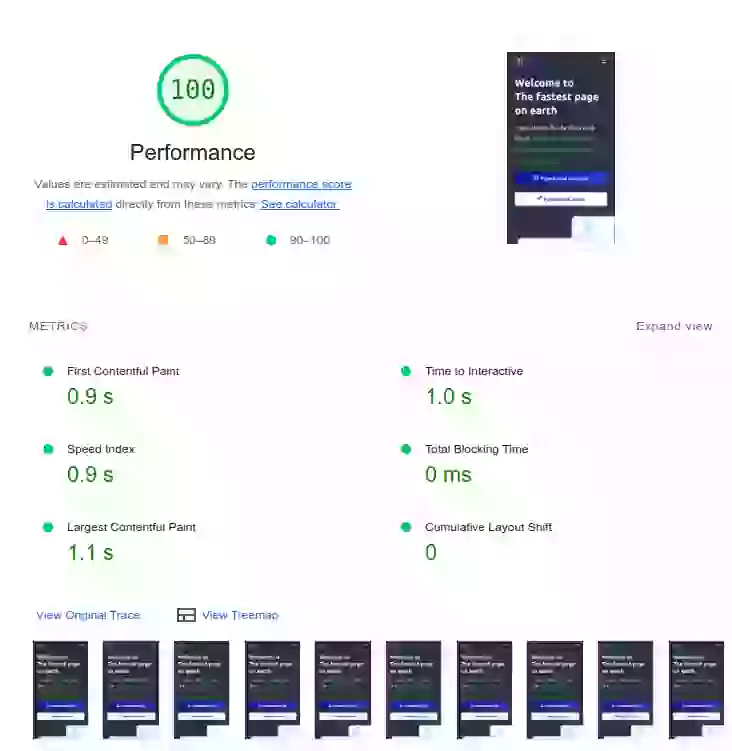
Lighthouse says 100, so why do I fail?
Because Google ranks on CrUX, and Lighthouse tests one simulated visit. Your visitors are on cheap Android phones and bad hotel wifi, and they click on things Lighthouse never touches. INP does not even exist in a Lighthouse run.
CrUX gives you a pass or a fail per URL group. To find out which page, device and element is behind the fail, I use Real User Monitoring: CoreDash, which I built for exactly this. It splits the data by device, country and page template, and points at the LCP element or the interaction that is slow.
How to Measure the Core Web Vitals
Measurement Tools Compared
| Tool | Data Type | Measures CWV? | Use it for |
|---|---|---|---|
| CrUX (Chrome User Experience Report) | Field | Yes (official) | The numbers Google uses, per origin or URL |
| PageSpeed Insights | Field + Lab | Yes (via CrUX) | Quick check: CrUX data plus a Lighthouse run |
| Lighthouse | Lab only | No | Finding issues on one page |
| Chrome DevTools | Lab only | No | Reading a trace, the waterfall, the LCP element |
| CoreDash (RUM) | Field | Yes | Today's data, per page, device and element |
| Google Search Console | Field (CrUX) | Yes | Which URL groups pass and which fail |
CrUX Data
The CrUX dataset holds the Core Web Vitals of every site with enough Chrome traffic. It is the official dataset of the Web Vitals program. You can get to it in a few ways:
- CrUX Vis shows how an origin or URL has scored over the last months. It replaced the old CrUX Dashboard in Looker Studio, which Google shut down at the end of 2025.
- CrUX on BigQuery has the origin level data of every site in CrUX, with full histograms per metric, updated monthly. Good for comparing a site with its competitors.
- The CrUX API gives you the data per page or origin, filtered by device type and metric, for when you want the numbers in your own tools.
- PageSpeed Insights shows the CrUX data for a URL above a Lighthouse report. It opens on the mobile tab. Stay there: the desktop tab is often green and makes people think they pass.

Monitoring with RUM
RUM data comes from a small script on your own site that measures every visit. It measures the same Core Web Vitals as CrUX, with the details CrUX leaves out. CrUX is anonymized, stops at URL level and always looks at the last 28 days. RUM shows you yesterday, per page, device, country and browser, and it tells you which element caused the slow LCP or the layout shift. That is why most people who fix Core Web Vitals for a living run RUM next to CrUX.
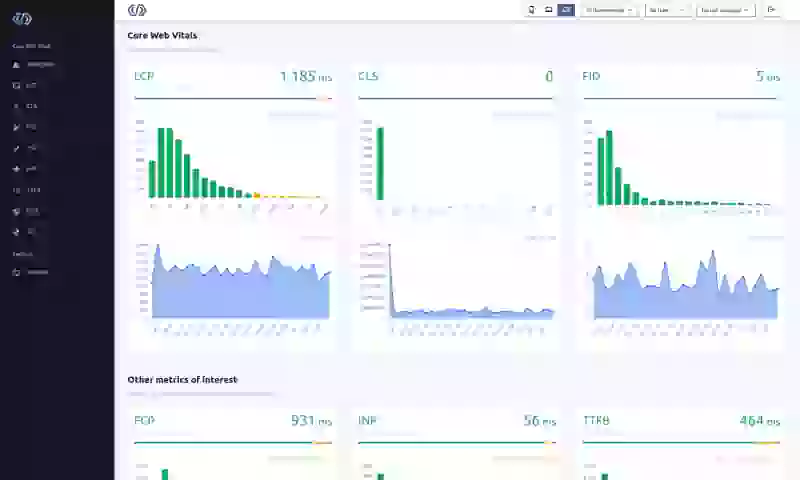
Lighthouse
Lighthouse does not measure the Core Web Vitals. It loads one page, once, on a simulated phone with a throttled connection. It starts with an empty cache, never navigates to a second page and never clicks.
It is still the fastest way to see what blocks rendering, which image is the LCP element and which scripts keep the main thread busy. Ignore half of the list, though. Minifying CSS saves a few kilobytes and none of your visitors will notice.
Run it in PageSpeed Insights, in Chrome DevTools or with the Lighthouse command line tool.
How Many Sites Pass?
The Chrome team publishes the CrUX numbers every month, on the second Tuesday, in the CrUX release notes. These are the shares of origins with a good score, all devices together:
| Metric | August 2025 | August 2026 | Notes |
|---|---|---|---|
| LCP | 66.7% | 68.1% | Lowest of the three, so for most sites LCP decides the pass |
| INP | 85.7% | 85.3% | Down every month since March; Google has no explanation yet |
| CLS | 80.1% | 81.5% | Best of the three |
| All three | 53.5% | 55.6% | Out of 18.3 million origins |
Compare the same month year on year. December swings every year (the Chrome team has seen it since CrUX launched), so one bad month says little. For TTFB and FCP, which are not in the release notes, see the Time to First Byte guide and the First Contentful Paint guide.
How to Improve the Core Web Vitals
Where I start: p75 per metric on mobile, then the URL group Search Console flags, then the trend. A sudden drop usually points at a deploy. A slow slide is third party scripts piling up, one tag at a time.
Every release can break something again, so keep watching your field data after the fix goes live. And the metrics affect each other. font-display: swap gets your text on screen sooner, which can help LCP, but when the web font is a different size than the fallback, the swap causes a layout shift. One guide per metric:
- Improve the Largest Contentful Paint
- Improve the Interaction to Next Paint
- Improve the Cumulative Layout Shift
Two diagnostic metrics hold LCP back:
- Time to First Byte (TTFB): the browser cannot start on the page before the HTML arrives. With a slow TTFB, a good LCP is almost impossible. Caching the HTML at your CDN is usually the quickest win.
- First Contentful Paint (FCP): the first paint of any content. Until then the visitor stares at a white screen.
For a step by step list, use the Core Web Vitals Checklist.
Core Web Vitals in Search Console
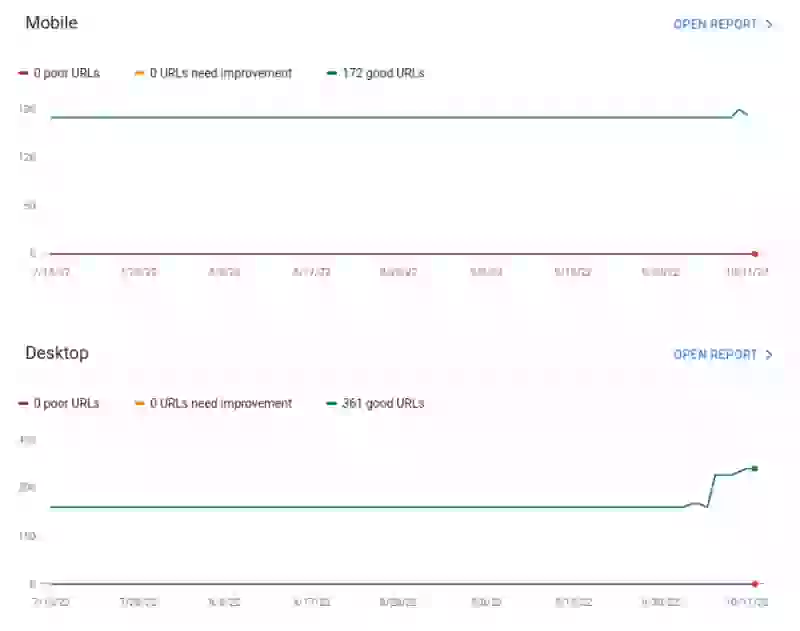
Google used to group the Core Web Vitals with HTTPS, mobile friendliness and intrusive interstitials as "page experience". Google removed the Page Experience report from Search Console in November 2024. The Core Web Vitals report is still there, under 'Experience'.
That report groups your URLs by template and shows which groups pass. It covers the last 28 days, so two weeks after a fix goes live, half of what it shows is still the old site.
Performance degrades the moment you stop watching.
I set up the monitoring, the budgets, and the processes. That is the difference between a fix and a solution.
Let's talkCore Web Vitals FAQ
Learning about the Core Web Vitals
What should you learn to become a Core Web Vitals expert?
Some Core Web Vitals problems take five minutes. Others take years of experience. You need four things.
First, how browsers work. Read a trace in the Performance panel until you can tell parsing, style, layout and paint apart without the labels.
Second, JavaScript. I spend a lot of my time explaining to developers why their code is slow. Slow code hurts INP, and usually LCP and FCP too.
Third, HTML and CSS. There is often a fast and a slow way to build the same component.
Fourth, networks and servers: caching headers, compression, HTTP/2 and HTTP/3. Large companies have good developers, and they will ask you about all four.
Improving the Core Web Vitals
Do Core Web Vitals plugins work?
Sometimes. There are a lot of plugins that promise better Core Web Vitals, WP Rocket for example. I could talk for hours about them, so I will keep it short.
It depends on what is wrong. Images that are not lazy loaded, scripts that are not deferred: a plugin fixes that. A slider that rebuilds the layout with JavaScript or a DOM with 5,000 elements stays as it is. And the "delay all JavaScript until the first interaction" trick moves all that work onto the first click, which is exactly what INP measures.
A plugin does what a good developer can do in a few hours. The hard problems are still there afterwards.
Should I focus on mobile or desktop?
Mobile. Phones have less bandwidth, less memory and a slower CPU than the average desktop. Pass on mobile and desktop usually passes too.
There are exceptions. The desktop viewport is bigger, so the LCP element can differ: on mobile it is often a heading, on desktop an image further down. Desktop also has more elements on screen that can shift, so CLS can be worse there.
Measuring: CrUX, RUM and Synthetic Data
If URL level data is unavailable, how does Google assess Core Web Vitals?
Google uses CrUX data for the URL first. If that URL has too little traffic, Google may use a group of similar URLs (Search Console shows these groups). Without group data, it uses the data for the whole origin.
Is the Core Web Vitals data real time?
No, but it is not 28 days old either. CrUX data is about two days old. What you see is p75 over the last 28 days, so a fix that went live today is one day out of 28 tomorrow. On a site that was borderline, p75 can move within a week or two. On a site that was slow everywhere, give it the full four weeks. More on the 28 day window.
Why is there no data in the Search Console or on any other CrUX tool?
Google does not have enough visits from Chrome users on your site. CrUX only reports pages and origins above a minimum amount of traffic. New sites, small sites and pages behind a login often have no data at all.
Will Lighthouse scores affect the Core Web Vitals?
No. Google uses CrUX field data, and your Lighthouse score is not part of it. Use Lighthouse to find what slows a page down. The Core Web Vitals only move when real visitors get a faster page.
Common Core Web Vitals Questions
What are the 3 Core Web Vitals?
Largest Contentful Paint (LCP) for loading, good under 2.5 seconds; Interaction to Next Paint (INP) for responsiveness, good under 200 milliseconds; and Cumulative Layout Shift (CLS) for visual stability, good under 0.1. A page passes when all three are good at the 75th percentile.
Is there a Core Web Vitals score?
No. There is no single number. Each metric is good, needs improvement or poor at p75, and a URL passes when all three are good. The 0 to 100 score in PageSpeed Insights is the Lighthouse performance score. That is a lab score, and Google does not rank on it.
Are Core Web Vitals a ranking factor?
Yes, since June 2021. A small one. A slow page with the best answer still outranks a fast page with a weak one. When two pages are about equally good, the one that passes has the edge.
What is the difference between field data and lab data?
Field data comes from real visitors, measured by their own browsers on their own devices and networks. Lab data comes from a test on a simulated device, like Lighthouse or WebPageTest. Lab data is repeatable and good for debugging. Google only uses field data for the Core Web Vitals, so a perfect Lighthouse score does not mean you pass, and a bad one does not mean you fail.

