Core web vitals visualizer
We are proud to present the core web vitals visualizer

We are proud to present the core web vitals visualizer.
Today we launched the free Core Web Vitals visualizer in the Chrome Web Store.
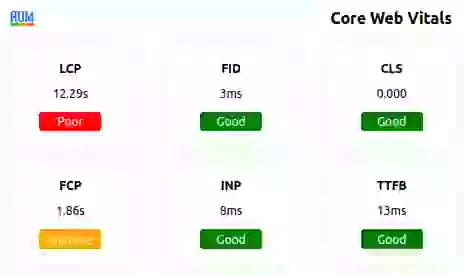
The Core Web Vitals visualizer is a Chrome plug-in that helps users track and visualize the core web vitals of a page. These metrics include the largest contentful paint, first input delay, cumulative layout shift, first contentful paint, interaction to next paint, and time to first byte. The plug-in creates an overlay that shows the user which elements are responsible for visual instability and which events cause a delay in input. Additionally, the plug-in breaks down the core web vitals into their basic components, allowing users to get a more detailed understanding of how a page is performing. The plug-in is available for free on the Chrome Web Store.
As a core web vitals specialist I spend a lot of time checking how a page reacts and responds when I interact with it. What does that do to the core web vitals and how do the core web vitals change when I switch to mobile emulation or disable browser caching?
Sure I use RUM tracking. That tells me on a page specific level which metrics pass and fail core web vitals. But why do they fail? That is something that you can really only figure out when you interact with the page.
To save myself a whole lot of time I decided to automate this a small part of a lengthy process and create a Chrome plug-in that will do some of the tedious work for me. The result is the core web vitals visualizer. I decided to make this plug-in available for everyone. so go ahead and check it out on the chrome Web Store.
What does the core web vitals visualizer I do?
First it records the core web vitals based on and your interaction with the page. IT Tracks the largest contentful paint, the first input delay, the cumulative layout shift, the first contentful paint, the interaction to next paint and the time to first byte.

Next it will create an overlay that will visualize all those metrics. This will tell you what element the largest contentful paint is, which elements cause visual instability and, if you have interacted with the page, which event caused the first input delay.

Finally when you click on any of the metrics the core web vitals visualizer will breakdown these metrics into their most basic components.

Why not use lighthouse?
Second: Lighthouse will not give you real user, real interaction results. For example Lighthouse will not measure the FID and INP. It will not visualize the different stages of CLS for me and it will also not Breakdown the LCP into their different sub-parts.
Give the Core Web Vitals Visualizer a try!
Head down to the Chrome Store and install the Core Web Vitals visualizer. And just maybe ... if you like it leave a review. I would appreciate that.
Need your site lightning fast?
Join 500+ sites that now load faster and excel in Core Web Vitals.
- Fast on 1 or 2 sprints.
- 17+ years experience & over 500 fast sites
- Get fast and stay fast!

